Know your liquidation price before the wick does.
Funding rates and liquidation thresholds, surfaced before you open the position. The same risk intelligence an OTC desk quotes internally — available via terminal and API to any perpetuals trader.
The Problem
of on-chain perpetuals liquidations occur within 2% of mark price — inside the funding-adjusted threshold retail platforms don't surface before entry
typical lag between a meaningful funding rate shift and the moment a retail position manager sees it — by which point sizing decisions are already locked
estimated on-chain liquidations recorded in a single high-volatility 24h window — cascade risk builds silently across stacked open interest layers until a trigger price is reached
Stats represent on-chain observations from publicly available blockchain data, 2023–2025. Not financial advice.
From protocol contract to position intelligence, in under a second.
Aark reads funding rate state and open interest directly from protocol smart contracts via archive-node access — no third-party data feed, no 15-minute delayed snapshot.
Mark price is computed from four oracle sources and cross-validated for latency anomalies. Feeds lagging more than 200ms relative to peers are flagged and down-weighted before the composite is surfaced.
Liquidation thresholds are simulated across open interest layers. You see the density clusters — the price levels where forced selling concentrates — before the market price reaches them.
Three signals. One position decision.
Real-time and historical funding rates normalized across four protocol feeds. Whether the market is long-biased or short-biased, and by how much — before you size your position.
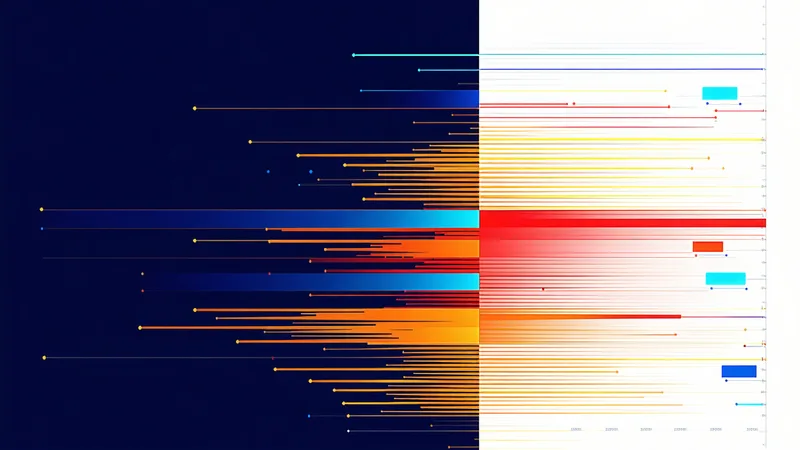
Explore Funding RatesOpen interest density mapped by price level. Cascade zones show where forced selling concentrates — and how much OI triggers if the level is reached. Not a general heatmap: a pre-position cascade simulation.
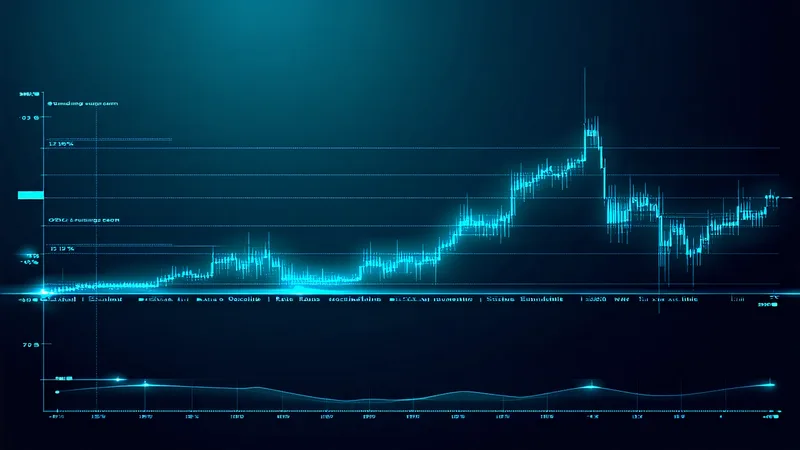
Explore Liquidation MapsMark price feed with oracle source transparency and per-feed latency scoring. You see which oracle the protocol is actually using and what its lag is — the same view an OTC desk builds internally to avoid oracle-spike liquidations.
Explore Mark PriceSample from the feed.
Simulated data for illustration. Real data available via Aark Terminal.
Perpetuals risk, explained precisely.
Funding rates are the invisible hand that keeps perpetual contracts close to spot. Understanding their mechanics is the first step to not getting squeezed.
When a cascade starts, price and liquidations feed each other. Here's the mechanics — and how Aark's heatmap shows you where the zones are before they trigger.
Institutional desks don't open a perpetual position without checking six specific data points. This is the condensed version of that checklist.
Check the cascade zones before you click send.
OTC desks check funding rate environment, liquidation density, and oracle quality before every perpetuals position. Aark surfaces all three — before the order goes in, not after the wick.