Analytics Dashboard
Cross-protocol funding rate aggregation, open interest heatmaps, and cascade simulation — one interface.
Six views. One pre-position workflow.
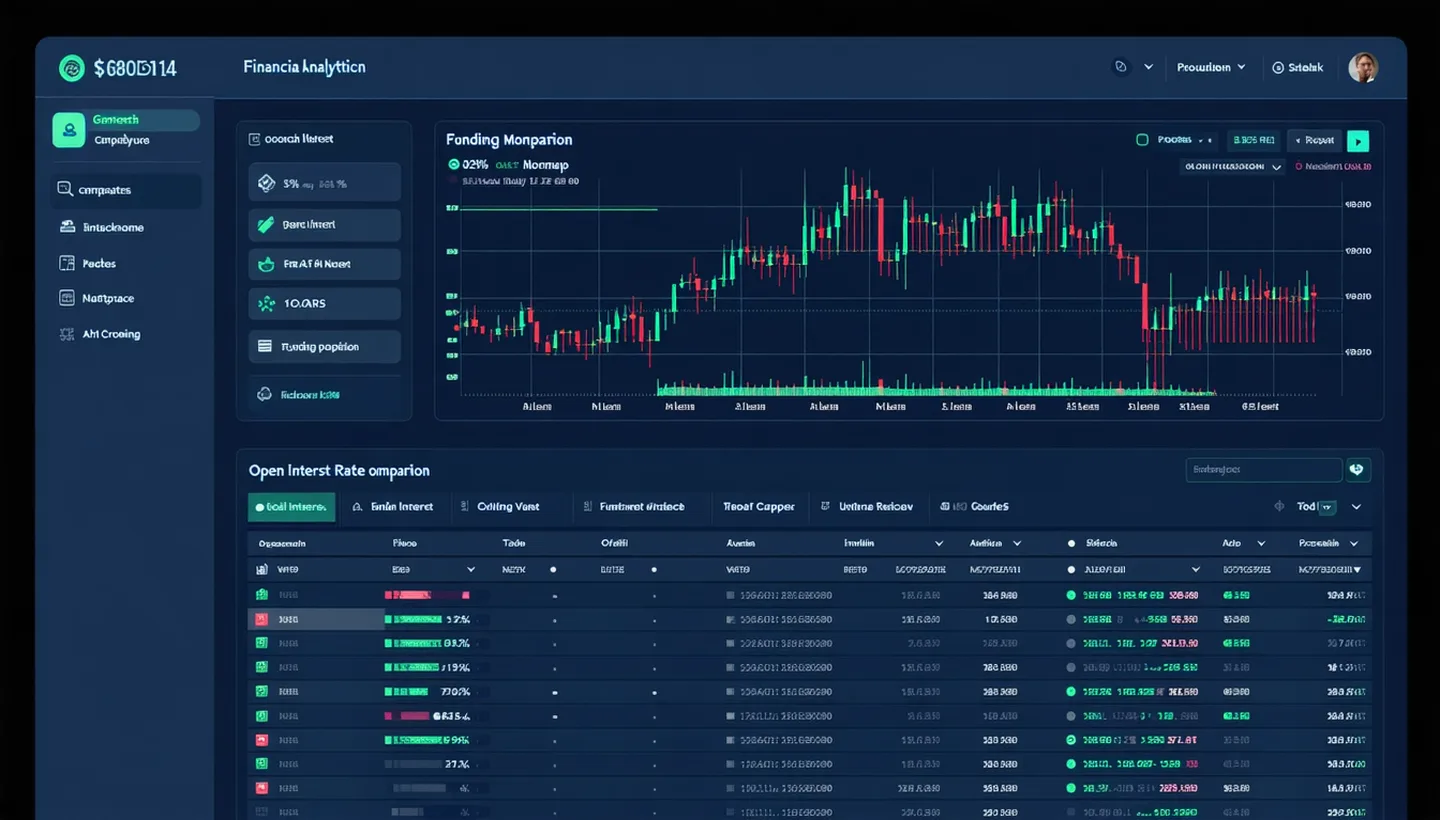
Pull funding rates from four on-chain protocol feeds simultaneously. Normalize for settlement intervals and compare market bias across pairs in a single view.
Visualize where open interest is concentrated by price level. The heatmap updates every 250ms — you see the density shifting in near-real time as positions build or unwind.
Model the forced-selling chain if price touches a given level. Aark simulates how liquidations feed each other across a stacked open interest cluster.
Scroll back through 90 days of normalized funding rate history. Identify recurring patterns: persistent long bias before corrections, pre-settlement rate spikes, overnight normalization windows that active traders and arbitrage desks monitor.
Click any pair to expand: mark price history, oracle sources, average funding rate over rolling windows, and the current liquidation threshold band.
Download any dataset as CSV. Set webhook or email alerts for funding rate thresholds and liquidation cascade risk scores. Trader plan and above.
Explorer plan is free. No expiry.
Access the Analytics Dashboard on Explorer with delayed data and a daily liquidation snapshot. Upgrade to Trader when you need live 250ms refresh and webhook alerts.